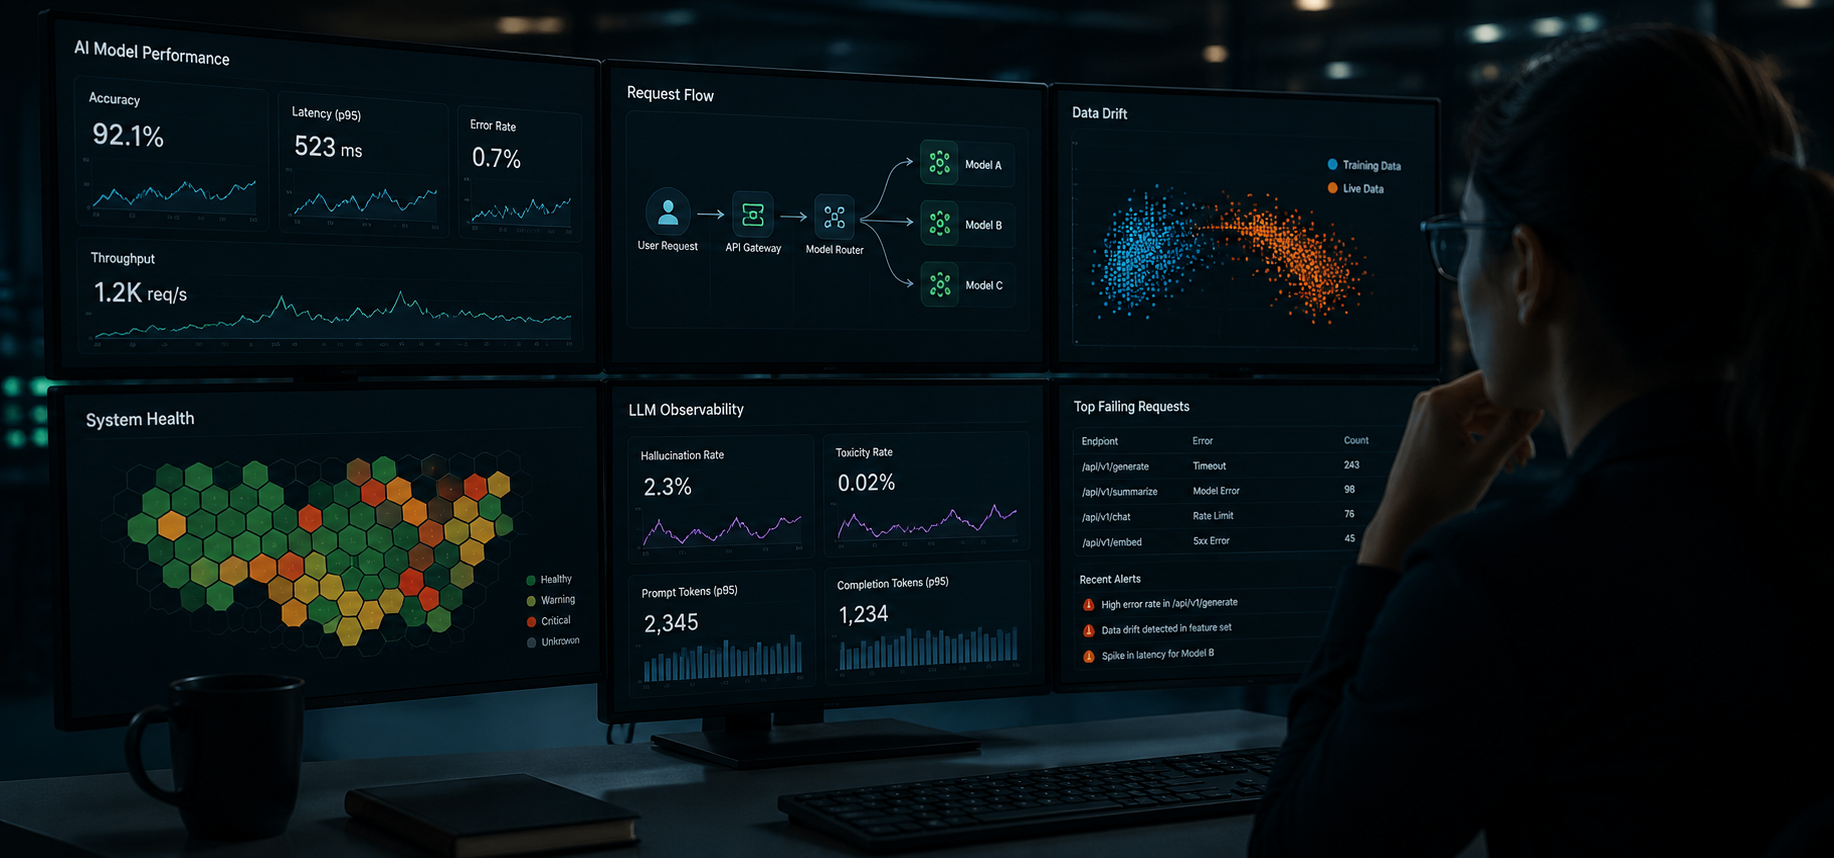
Enterprises monitor their models for latency and cost with great care, and for output quality almost not at all. So hallucinations surface as customer incidents instead of alerts.
Pull up the dashboard for almost any model in production today and you will find a tidy wall of green. Latency, well within target. Cost per token, trending down. Uptime, four nines. By every signal the operations team tracks, the system is healthy.
And it may, at that exact moment, be telling a customer something completely false with total confidence. The dashboard cannot see it, because the dashboard was built to watch a machine, not to judge an answer. That gap — between a model that is running and a model that is right — is the observability problem, and most enterprises have not yet noticed they have it.
The market has noticed. The question is whether the buyers have.
A new operational layer, arriving fast
LLM observability is now a category, not a feature. It sat around $2.69 billion in 2026 and is projected to reach $9.26 billion by 2030 — a 36 percent compound annual growth rate, the kind of curve that signals a structural shift rather than a fad. Gartner expects the adoption pattern to follow: by 2028, observability investment will accompany half of all generative-AI deployments, up from roughly 15 percent in early 2026.
What these tools watch is different in kind from traditional monitoring. They score the model's actual outputs against research-backed metrics, detect hallucinations, catch quality regressions before users do, control token spend, enforce governance policy, and trace the behavior of agents as they chain decisions together. The category leaders now process more than 20 million traces a day, which is itself a measure of how much production AI is running without anyone watching its work.
Why your green dashboard lies
Traditional observability answers one question: is the system available? It is exquisitely tuned to detect the failures of the last era — a server down, a queue backed up, a latency spike. Those failures announce themselves. They break something visible.
The failures of generative AI do the opposite. They are silent and well-formed. A hallucinated citation, a confidently wrong number, a subtle drift in tone that erodes trust over weeks — none of these register as errors. The request succeeded. The response was fast. The model was, in every operational sense, up. The content was simply wrong, and uptime monitoring has no opinion about content.
A model can be one hundred percent available and one hundred percent wrong at the same time, and every dashboard you own will show green.
This is the trap of measuring the infrastructure instead of the output. The reassurance is real, and it is false. Worse, it is actively misleading, because a wall of green tells leadership the AI is under control precisely when the thing that matters most — the quality of what it says — is unmeasured.
Visual 1 — What each layer can and cannot see
Monitoring dimension | What it catches | What it misses |
|---|---|---|
Uptime & latency | Outages, slow responses, timeouts, capacity limits | Whether the fast response was true or invented |
Cost & tokens | Spend overruns, runaway prompts, inefficient calls | Whether the spend bought a correct answer or a confident lie |
Output quality & faithfulness | Hallucinations, ungrounded claims, answers that contradict the source | Nothing operational — but requires evaluation, not monitoring, to run |
Drift | Quality regressions after a model or prompt change | Little, if instrumented — but most teams never instrument it |
How to read it: The top two rows are where most enterprises live. The bottom two are where the customer-facing risk actually sits. The columns make the trade explicit: classic monitoring is blind to correctness by design.
From monitoring to evaluation
The shift the leading platforms represent is from monitoring to evaluation. Monitoring asks whether a system behaved. Evaluation asks whether it was correct. The newer tools score each trace against faithfulness and hallucination metrics and raise an alert when faithfulness drops below threshold — the same operational reflex that latency alerting brought to web infrastructure a decade ago, pointed at a harder target.
The contrarian reading is that traditional observability is not merely insufficient here. It is a liability, because the false comfort it provides delays the investment that would catch the real failures. A team confident in its green dashboard is a team that finds out about its hallucination problem from a customer, a regulator, or a screenshot on social media.
What this means for leaders
Treat output quality as a first-class operational metric. Faithfulness, hallucination rate, and grounding belong on the same dashboard as latency and cost, with the same alerting and the same on-call response. If a quality regression cannot page someone at 2 a.m., it is not being managed.
Instrument drift before you change anything. Every model swap, prompt edit, and retrieval update can quietly degrade output quality. Without a baseline scored against research-backed metrics, you will ship the regression and learn about it from the field. The baseline is cheap; the field incident is not.
Budget for evaluation as deployment, not experiment. The market trajectory — from 15 percent of deployments today toward half by 2028 — means evaluation tooling is becoming table stakes. Fund it as core production infrastructure now, while it is a competitive edge, rather than later, when its absence is an audit finding.
The uncomfortable truth is that a model in production is making thousands of unsupervised judgments an hour, and the dashboards most teams trust were never designed to grade them. Closing that gap is not a tooling refresh. It is the difference between knowing your AI works and merely hoping it does while the lights stay green.
A BusinessInfomatics original. Synthesized from 2026 LLM-observability market analyses by Confident AI and Galileo and from Gartner adoption projections.